BI Consulting, Project Delivery & Training

Advanced Certification In
Data analytics
Advanced Certification In
Data analytics
Data Analytics Course Content

Fundamentals Of Analytics

Excel Analytics

SQL Server

Power BI

ETL (Extract Transform Load)

Communication Gym Membership
Data Analytics Course Review
EXCELLENTTrustindex verifies that the original source of the review is Google. Very good courses for beginners. And faculty was teaching friendly to the students. Specially thanks to kedar sir for sharing knowledge and experience with usPosted onTrustindex verifies that the original source of the review is Google. Learning at Opine Group has been an excellent experience. The staff is very friendly and helps you in every step of the way. It is an exceptional institute for learning about various tools of data analysisPosted onTrustindex verifies that the original source of the review is Google. One stop solution who wants to start their career into Data Analytics field.Posted onTrustindex verifies that the original source of the review is Google. It was a great learning experience and we really enjoyed the trainingPosted onTrustindex verifies that the original source of the review is Google. I attended a foundations course here. The teaching was fantastic and very close to actual work. The teachers are very experienced working professionals, which adds to the learning experience.Posted onTrustindex verifies that the original source of the review is Google. Very good courses for beginners. And faculty was teaching friendly to the students. Specially thanks to Anand Sir for sharing knowledge and experience with usPosted onTrustindex verifies that the original source of the review is Google. Teaching skill is good and really we took industrial experience from herePosted onTrustindex verifies that the original source of the review is Google. I joined opine group for SQL class. Inspite of being from non-it background, Shubhangi mam has taught SQL effectively. As the class has all concepts from basic, it is an easy learning experience for everyone.
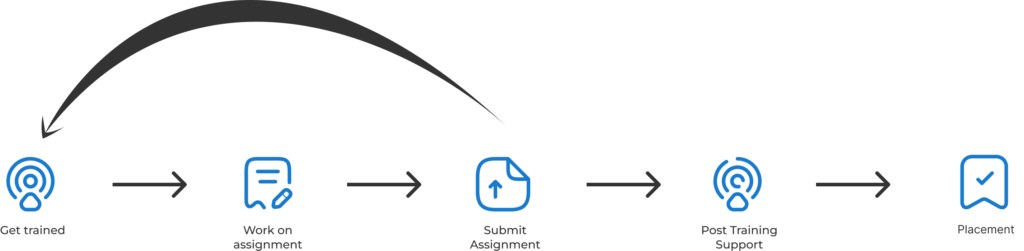
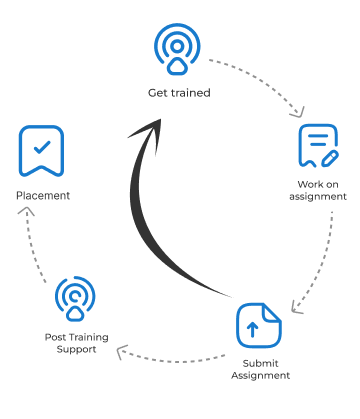
LEARNING PATH
KNOW MORE ABOUT
THE PROGRAM
-
100% placement
assistance - Hands on Assignments
- Access to free guest lecture & webinars
- Mock & Final Interview preparation
- Practitioner’s Approach
- Course completion certification from Opine
- Experienced faculty (30+ years)
- Profile building/Resume Writing support
- Membership to Communication Gym
Let’s walk through your journey at OPINE GROUP
• Business Intelligence & Data Warehouse concepts
• Introduction to Business Intelligence – what, where and
how?
• Need for Business Intelligence / Analytics
• BI /DW Lifecycle
• Real life based exercises to understand BI phases
• Requirements gathering
• Analytics and Approach for Solution Design
• Data Modeling (Dimensional)
• Dimensional Modeling Process and Scenario based model
designing
• Real time hands on work to understand Data Visualization
• Analytics Demo
• Real life demo
• Career Opportunities discussion and guidance
• Open discussion
• Steps to be carried out
• Short Term
• Long Term
• Fundamentals and Excel interface
• Introduction to analytics, Organizational structure,
Concepts of OLTP, OLAP, Normalization, De-normalization,
Primary Key, Dimensions, Facts, Factless fact Foreign Key,
VLookup, Ribbon Tabs, Formatting features, Speak Cells,
Quick Access toolbar.
• Charts
• Basic chart, Series, Combination charts, Dynamic chart
ranges with Excel tables, Histogram, Treemap chart,
Sunburst, Pie and Doughnut charts, Sparklines, Use of
dashboard
• Pivoting
• Pivoting – Pivot tables, Slicers and Timelines, Creating
Pivot charts
• Excel features / Data quality
• Auto Fill, Flash Fill, Fill Series, Use of
formula, Recognizing formula and input cells, Adding note
/ comment, Creating custom list, Data Validation, Screen
Tip and few shortcuts, Assignment, Excel shortcuts for
navigation, Copying, Moving and Hiding Worksheets,
Freeze panes and split screen, Hide and unhide, Insert and
adjust columns and rows, Copying and pasting data
• Data Protection
• Protecting Worksheets and specific ranges, Assignment,
Order of precedence, Simple formulae, Excel’s Essential
rule, Absolute and Relative referencing.
• Excel functions
• Range names for clarity, Referencing other Workbooks or
Worksheets, Circular references, Combine values from two
or more cells to one cell, Assignments, Functions like
COUNT, COUNTA, COUNTBLANK, COUNTIFS, SUM,
AVERAGE, SUMIFS, AVERAGEIFS, MAX and MIN (Include by
criteria), Basic DATE functions, Time calculations.
• Data population and error handling
• Handling formulae errors, Different types of errors, IF
(then, else) function, VLOOKUP function, Assignment, Sort,
Unsort, Subtotal, Filter, Remove blank cells, Fill empty cells,
Conditional formatting.
• Automation
• Macro Introduction
• Conclusion
• Project
• RDBMS
• What is RDBMS?
• Basic concepts of RDBMS
• Different data types
• KEYS concepts
• SQL Basic
• Introduction SQL (Structured Query Language)
• Fundamentals of SQL
• SQL Tables, Joins, Variables
• SQL Advance
• SQL Functions, Subqueries, Views, Rules
• Condition based queries using various operator
• Data Modeling
• Different type of joins (Basic, Advance)
• Aggregate Function
• Windows Functions
• Use of CTE (Common table expression) with practice
• Hands on exercise on live projects
• Introduction to BI and need for visualization
• BI life cycle
• What is analysis
• Importance of data visualization to the industry
• Introduction to Power BI
• Installation
• Connecting to the data source
• Elements of report windows
• Creating Visualization
• Creating visualization such as column charts, line charts,
pie charts, table, matrix and many more
• Formatting the charts
• Grouping and binning (Creating histogram)
• Filtering the data
• Types of filters (Visualization level, page level, across page)
• Slicers
• Base, Advance and Limiting filters
• Concept of internal (context) filters and internal filters
• Transformation using Dax and modeling
• Data transformation using Dax
• Creating new relationship
• Create new tables in Dax
• Creating Measures and columns in Dax
• Navigation
• Creating dashboard pages
• Using Hierarchies for Drill Down navigation
• Creating drill through across pages
• Data refresh and scheduling
• Advanced transformations
• Data cleansing techniques
• Full Load and Incremental Load
• Standard tasks
• Container tasks
• Data profiling and testing techniques
• Deployment and job scheduling
activities.
• Business Intelligence & Data
Warehouse concepts
• Introduction to Business
Intelligence – what, where and
how?
• Need for Business Intelligence /
Analytics
• BI /DW Lifecycle
• Real life based exercises to
understand BI phases
• Requirements gathering
• Analytics and Approach for
Solution Design
• Data Modeling (Dimensional)
• Dimensional Modeling Process
and Scenario based model
designing
• Real time hands on work to
understand Data Visualization
• Analytics Demo
• Real life demo
• Career Opportunities discussion
and guidance
• Open discussion
• Steps to be carried out
• Short Term
• Long Term
• Fundamentals and Excel interface
• Introduction to analytics,
Organizational structure,
Concepts of OLTP, OLAP,
Normalization, De-normalization,
Primary Key, Dimensions, Facts,
Factless fact Foreign Key,
VLookup, Ribbon Tabs, Formatting
features, Speak Cells,
Quick Access toolbar.
• Charts
• Basic chart, Series, Combination
charts, Dynamic chart ranges with
Excel tables, Histogram, Treemap
chart, Sunburst, Pie and Doughnut
charts, Sparklines, Use of
dashboard
• Pivoting
• Pivoting – Pivot tables, Slicers and
Timelines, Creating Pivot charts
• Excel features / Data quality
• Auto Fill, Flash Fill, Fill Series, Use of
formula, Recognizing formula and
input cells, Adding note /
comment, Creating custom list,
Data Validation, Screen Tip and few
shortcuts, Assignment, Excel
shortcuts for navigation, Copying,
Moving and Hiding Worksheets,
Freeze panes and split screen, Hide
and unhide, Insert and adjust
columns and rows, Copying and
pasting data
• Data Protection
• Protecting Worksheets and
specific ranges, Assignment,
Order of precedence, Simple
formulae, Excel’s Essential
rule, Absolute and Relative
referencing.
• Excel functions
• Range names for clarity,
Referencing other Workbooks or
Worksheets, Circular references,
Combine values from two or more
cells to one cell, Assignments,
Functions like COUNT, COUNTA,
COUNTBLANK, COUNTIFS, SUM,
AVERAGE, SUMIFS, AVERAGEIFS,
MAX and MIN (Include by criteria),
Basic DATE functions, Time
calculations.
• Data population and error handling
• Handling formulae errors, Different
types of errors, IF (then, else)
function, VLOOKUP function,
Assignment, Sort, Unsort, Subtotal,
Filter, Remove blank cells, Fill
empty cells, Conditional
formatting.
• Automation
• Macro Introduction
• Conclusion
• Project
• RDBMS
• What is RDBMS?
• Basic concepts of RDBMS
• Different data types
• KEYS concepts
• SQL Basic
• Introduction SQL (Structured
Query Language)
• Fundamentals of SQL
• SQL Tables, Joins, Variables
• SQL Advance
• SQL Functions, Subqueries, Views,
Rules
• Condition based queries using
various operator
• Data Modeling
• Different type of joins (Basic,
Advance)
• Aggregate Function
• Windows Functions
• Use of CTE (Common table
expression) with practice
• Hands on exercise on live projects
• Introduction to BI and need for
visualization
• BI life cycle
• What is analysis
• Importance of data visualization to
the industry
• Introduction to Power BI
• Installation
• Connecting to the data source
• Elements of report windows
• Creating Visualization
• Creating visualization such as
column charts, line charts, pie
charts, table, matrix and many
more
• Formatting the charts
• Grouping and binning (Creating
histogram)
• Filtering the data
• Types of filters (Visualization level,
page level, across page)
• Slicers
• Base, Advance and Limiting filters
• Concept of internal (context) filters
and internal filters
• Transformation using Dax and modeling
• Data transformation using Dax
• Creating new relationship
• Create new tables in Dax
• Creating Measures and columns in
Dax
• Navigation
• Creating dashboard pages
• Using Hierarchies for Drill Down
navigation
• Creating drill through across pages
• Data refresh and scheduling
• Advanced transformations
• Data cleansing techniques
• Full Load and Incremental Load
• Standard tasks
• Container tasks
• Data profiling and testing techniques
• Deployment and job scheduling
English through various activities.
Our Alumni works at


meet your mentors


why opine ?
With knowledge precipitated from the data, we use Business Intelligence and Analytics to enable intelligent, timely and actionable decisions and deliver greater value from same resources for you
14 YEARS experience
Empowering the users
Our Unique Methodology
– Practioner Aproach
– Personalized
– Industry Centric
Register for A free counselling session
BI Consulting, Project Delivery & Training is proudly powered by WordPress